In this article
Can conversations and business intel supercharge churn prediction?
Explore how conversations and BI signals can enhance churn prediction and customer success outcomes.

By Preetam Jinka
Co-founder and Chief Architect
Sep 15, 2024
3 min read
A churn prediction system predicts the likelihood of an account to churn. These predictions can happen as discrete Yes/NO predictions or probabilistic numbers.
This blog discusses the impact of adding customer conversations and business intelligence about the customer to the quality of churn prediction.
Background: Selecting Data for an Effective Churn Prediction System
Building a predictive system for churn and retention hinges on gathering the right data. Let's explore what data fuels such a system, considering how a B2B vendor interacts with its customers:
B2B Data Requirements:
Product Usage: Track how customers utilize the product through the user interface, API, and integrations. This reveals feature adoption, frequency of use, and overall engagement.
Customer Interactions: Capture interactions between customer users and your sales, customer success, and support teams. This encompasses messaging, meetings, emails, support tickets, and calls. These touchpoints offer insights into sentiment, pain points, and satisfaction levels.
Business Intelligence: Gather data on the customer's company performance, such as financial reports, funding rounds, headcount changes, and industry news. This contextualizes their situation and helps predict potential churn triggers.
Measuring Performance of Churn Prediction System
We will use the concepts of confusion matrix, precision, and recall as part of this analysis.
For this analysis, we gathered usage data, conversational data, and business intelligence from a historical data set (that had been synthetically extended)
With just usage data
At first, we trained a model for churn prediction using product usage data. Here are the results:
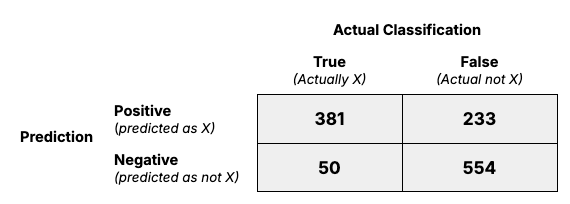
precision = 295 / (295 + 233)=56%
recall = 295 / (295 +136)=68%
With just product usage data, this model could predict churn with a precision of 56% and recall of 68%. This means that the model is missing 32% of true churners. For the model, these accounts seem to have product usage that resembles retained accounts, but they’re actually churning due to other factors.
With usage, conversations, and business environment data
With just product usage data, our prediction model could only catch 68% of true churners. This is because these accounts looked healthy only from a product usage perspective.
However, this didn’t consider valuable churn indicators coming from non-product sources like conversations, meeting transcripts, support tickets, and other customer interactions. It also didn’t consider external factors affecting the account, like industry news or leadership changes.
When considering 20% of churn attributable to non-product usage signals, this is what our new model’s performance looks like:
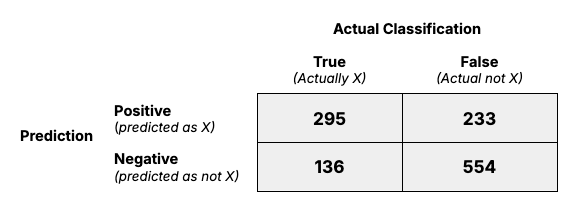
precision = 381 / (381 + 233)=62%
recall = 381 / (381 +50)=88%
86 accounts mistakenly predicted to retain based on the prior model are now correctly predicted to churn. With the true negative and false positives not being affected, the model’s precision has slightly increased to 62%, and recall has increased significantly to 88%.
Conclusion
Churn prediction models that only consider product usage are better at predicting retention rather than churn.
Product usage represents realized value by customers and is highly correlated with retention. But when many accounts churn even with high product usage, it means external factors may be at play. From our example, when just 20% of churn is explainable by external factors it reduces our missed churn predictions by almost half.
As shown in Stripe’s guide for building churn models, product usage is only one of many factors to consider and to build accurate models for predicting churn you must consider a broader range of signals.
