In this article
How to Measure and Improve Customer Churn | A CSM's Guide
Discover how to measure and reduce customer churn. Learn what a good churn rate is, common causes of attrition, and proven ways to improve retention. See how FunnelStory predicts churn early and helps teams act before risks turn into losses.

By Sanskar Suryawanshi
Visual Designer
Sep 05, 2025
6 min read
Last Updated: Oct 28, 2025
What Is Customer Churn-and Why It Matters
Customer churn, sometimes called attrition, is the percentage of customers who stop doing business with you in a given period. In a subscription model, it usually means someone cancels their plan. In e-commerce, it may mean a customer hasn’t returned to buy again within a set time frame.
Churn matters because it directly affects revenue. When customers leave, you lose not only the income they bring but also the opportunity for upsells, cross-sells, and referrals. Acquiring new customers is often far more expensive than retaining existing ones, which makes churn one of the most important metrics for any business to monitor.
How to Measure Churn 🔍
1. Pick a Time Frame
You need a set period to measure churn. For SaaS, a monthly or annual view works best. For retail or services, a quarterly period may be more useful. Choosing the right frame ensures the data reflects your actual business cycle.
2. Define a Churned Customer
A “churned customer” can mean different things depending on your business model. For example:
A subscription company: a user cancels their plan.
An online retailer: a customer has not purchased again in six months.
A mobile app: a user has not logged in or used features for 90 days.
Clear definitions prevent confusion and make it easier to compare churn across teams or reports.
3. Collect Your Data
Track the number of customers at the start of your chosen period. Then count how many you lost during that period. This data can come from CRM systems, billing software, or customer support tools.
4. Calculate the Churn Rate
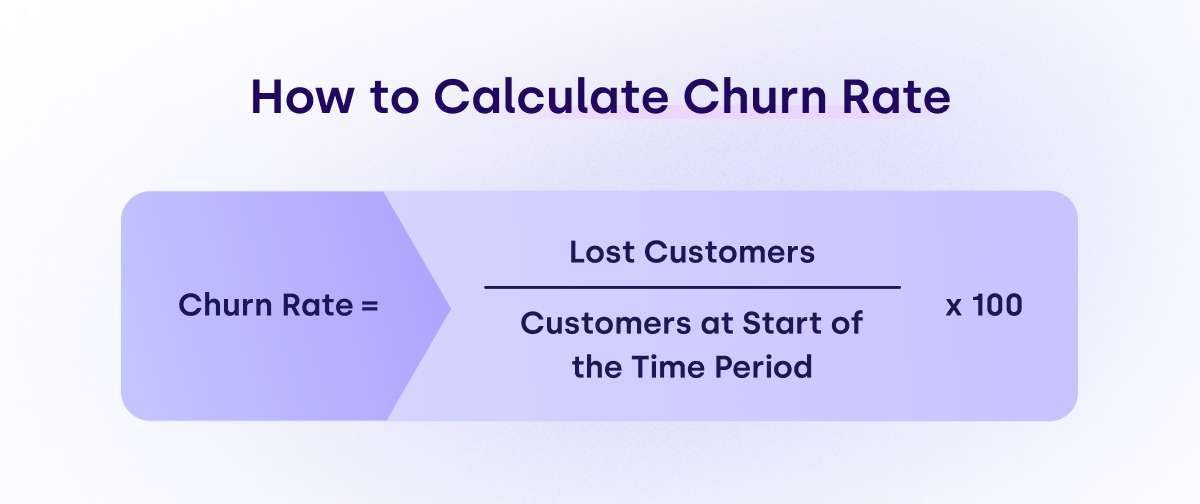
Use the formula: Churn Rate (%) = (Lost Customers ÷ Customers at Start) × 100
Example: If you begin the month with 1,000 customers and lose 75, your churn rate is 7.5%.
5. Segment for Deeper Insight
A single churn percentage is useful, but it doesn’t tell you why customers are leaving. Segment by customer type, industry, geography, or even by subscription tier. This often reveals patterns-for example, maybe small businesses leave faster than enterprise clients, or customers in a certain region cancel more often.
What Is a Good Churn Rate? 📈
A “good” churn rate depends on your industry, product, and growth stage.
SaaS companies: Annual churn under 5–7% is considered strong.
Telecom and subscription services: Monthly churn between 1–2% is common.
E-commerce: Repeat purchase rate matters more, but losing fewer than 20% of repeat buyers yearly is a positive sign.
The most important point: compare your churn rate to competitors in your industry and track it over time. Improvement, not perfection, should be the goal.
Most Common Reasons Behind High Churn Rates
High churn rarely happens by accident. The most frequent causes include:
Poor onboarding: Customers who don’t see value early are quick to cancel. A confusing setup or lack of guidance increases drop-off.
Weak product–market fit: If your product doesn’t solve a customer’s real problem, retention will always suffer.
Bad customer service: Slow responses, unresolved issues, or rude interactions are major churn drivers.
High pricing compared to value: If customers feel the price is too high for what they get, they’ll look for cheaper alternatives.
Better competitors: Customers leave if they see more features, better service, or better deals elsewhere.
Lack of engagement: Customers who stop using your product regularly often stop paying for it too.
Product complexity: A tool that is too hard to learn can frustrate users and push them out the door.
Understanding these reasons gives you a roadmap for where to act first.
How to Improve Churn
Listen to Customers
Survey customers after they leave and while they are still active. Ask about their main challenges, what they value, and what could be better. Insights from these conversations help you spot recurring issues.
Watch Warning Signs
Customers rarely disappear without warning. Signals such as reduced logins, fewer purchases, low product usage, or repeated complaints often predict churn. Tracking these signals lets you intervene early.
Deliver Strong Service
Fast, accurate, and empathetic support is critical. Make it easy for customers to get help on their preferred channels-chat, phone, or email. A single poor support experience can push a customer to leave, while strong service builds loyalty.
Offer Value Early
Onboarding is the moment customers decide whether your product is worth their time. Provide guided walkthroughs, training, or videos to help them see results quickly. Customers who get early wins are much more likely to stay.
Personalise Their Experience
Not every customer wants the same thing. Use data to recommend features, send targeted messages, or offer training relevant to their needs. Personalisation helps customers feel understood, which reduces churn.
Incentivise the At-Risk
If you notice customers pulling back, offer incentives to keep them engaged. This could mean discounts, free upgrades, loyalty rewards, or extended trials. The key is to make the customer feel valued without undercutting your pricing strategy.
Use Data to Be Proactive
Analytics can help you predict churn before it happens. Machine learning models or health scores based on product usage and customer support data highlight at-risk customers. Proactive outreach-before the cancellation-can make the difference.
Customer Churn Analysis and Measurement with FunnelStory
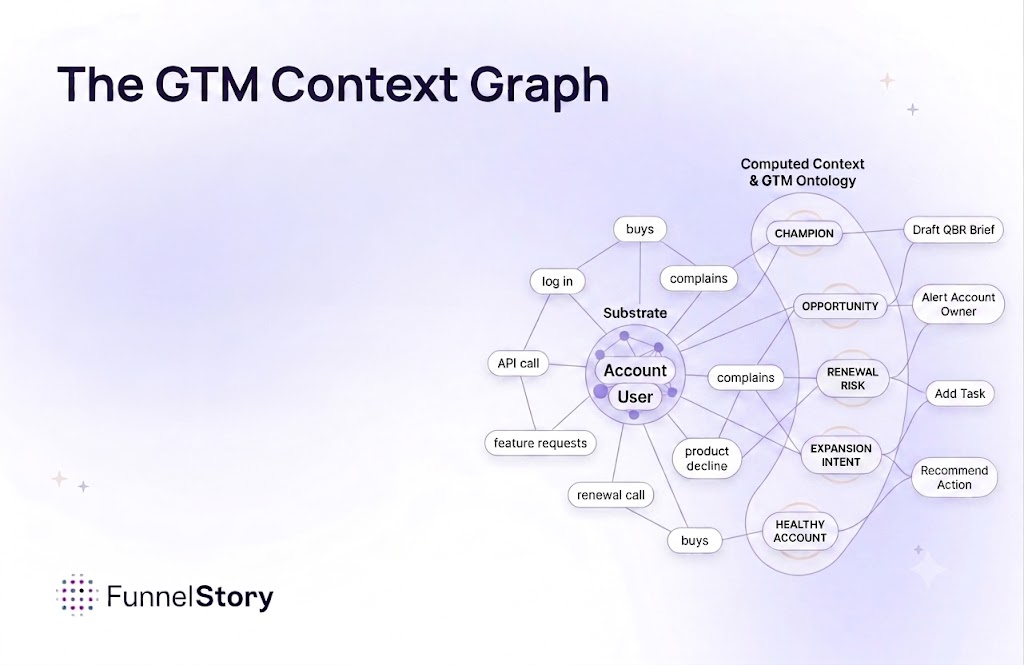
Measuring churn shows what happened. Analyzing churn explains why it happened and when it might happen again. FunnelStory helps Customer Success and revenue teams protect and grow accounts by combining usage data, business intelligence, and customer conversations into one clear view of health.
Predict Churn Before It’s Too Late
Most tools flag churn only after it happens. FunnelStory surfaces churn and renewal signals 3–9 months in advance, focusing on leading indicators like product usage drops, sentiment in conversations, or missed milestones. This gives teams time to act, not just react.
Understand the Full Customer Journey
Churn doesn’t occur in isolation. FunnelStory maps the entire customer journey, from onboarding to renewal, highlighting the key “needle movers” that drive retention or risk. This makes it easier to see where customers struggle and where they succeed.
Prevent Surprise Churn
FunnelStory reduces noise and uncovers risks hidden in everyday data. By analyzing patterns across emails, chats, and support tickets, it reveals early signs of disengagement and delivers clear, actionable recommendations.
Track Metrics That Matter 📊
Don’t just track how many customers leave. Also monitor:
Revenue churn: the percentage of revenue lost, which matters if higher-paying clients churn.
Net Promoter Score (NPS): measures customer loyalty.
Customer Satisfaction (CSAT): measures support quality.
Customer Lifetime Value (CLV): compares retention value against acquisition cost.
Tracking multiple metrics gives a clearer picture of the health of your customer base.
Final Thoughts
Churn is unavoidable, but it doesn’t need to be a constant drain. By measuring churn accurately, understanding why it happens, and taking proactive steps to improve it, you can build a more stable customer base and healthier revenue growth. Focus on what customers value, deliver it consistently, and always act early when signs of risk appear. Reducing churn is not about perfection-it’s about steady, ongoing improvement.