In this article
Predicting Churn/Retention in B2B SaaS - 101
A beginner’s guide to predicting churn and retention in B2B SaaS, covering data, models, and best practices.

By Arun Balakrishnan
Cofounder and Head of Product
Sep 15, 2024
12 min read
Last Updated: Oct 28, 2025
Churn happens when customers stop using a product or service. Retention, on the other hand, is when customers continue using the product or service.
Businesses use two key metrics to track churn/retention: GRR (Gross Revenue Retention) and NRR (Net Revenue Retention). GRR focuses solely on the revenue from existing customers, showing how much was lost due to churn. NRR further includes the retained revenue and any additional revenue gained from those same customers through upsells or expansions.
There are some variations to this definition, but they are immaterial to the purpose of this blog. We will also focus only on account-level churn/retention
Approaches for predicting churn and retention
Manual health scores
One approach to predicting churn and retention involves using health scores derived from predefined rules. While these rules leverage metrics and have a data-driven foundation, they remain manually crafted and subject to interpretation. Furthermore, health score rules present challenges for teams when it comes to:
Selecting relevant metrics
Assigning appropriate weights to these metrics
Establishing suitable thresholds for the selected metrics
Adapting these thresholds to different customer segments
ML-based prediction scores
Instead of manually setting up health score rules, a smarter approach is to leverage machine learning (ML). ML algorithms can analyze past customer churn and retention data to create predictive models for future outcomes.
Here are a few ML algorithms that can be useful for predicting churn and retention:
Logistic Regression: This is a regression model like linear regression but is designed for classification problems. It's easy to understand but assumes independent variables, which isn't always true.
Decision Trees: These are tree-based models for classification. They're simple and easy to interpret but can overfit the data if not carefully managed and need enough training data to be effective.
Random Forests: This method combines multiple decision trees to improve performance. It addresses some of the weaknesses of single decision trees but is less interpretable.
Neural Networks: These models are inspired by the human brain. They can be highly accurate but are complex and require a lot of training data, which might not be readily available for churn and retention prediction.
Ensemble approach
In practice, it is unlikely that any one algorithm will be a great predictor of churn or retention across all kinds of data.
A technique that addresses this problem is using ensemble methods, where multiple types of prediction models are combined to improve prediction accuracy.
Measuring the performance of a prediction system
Before we measure the performance of a prediction model for Churn/Retention, we need to define the concept of Confusion Matrix.
Confusion matrix
Churn/Retention Prediction solution vendors will employ a performance management system to check the validity/performance of their prediction system against a corpus of accounts that have already been known to be churned or retained.
Let us say if we are trying to predict if something is X or not X. In that case, we can create a matrix comparing predictions against actual results. The following examples will help us better understand the topic.
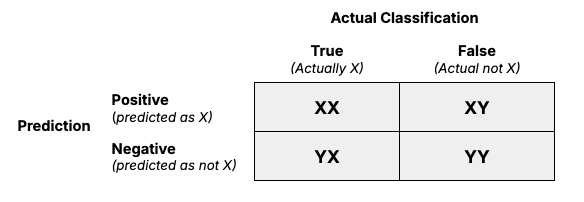
Based on the above, overall accuracy, whether each prediction is right or not, is one measure. We can also ask the question: Out of all your system's predictions, how many are right?
However, this one measure doesn’t paint the whole picture. For example, in a dataset where most customers are retained, a trivial model that predicts "retention" for every customer may have high accuracy but fail to capture churn effectively. This is why additional metrics are also important to track: precision and recall.
Precision
Precision answers the question: Of all the positive predictions made, how many were correct? In the context of churn prediction, this would translate to how many of the customers predicted to churn did churn. Precision is one way of measuring the number of false positives.
For the above Confusion matrix, precision can be defined as:
Precision = XX / (XX + XY)
Recall
Recall, also known as true positive rate, answers the question: How many positive cases did the system correctly identify? In churn prediction, this refers to how many of the actual churners your model successfully predicted. Recall is essential when it's important not to miss any true churners, even if it means making some false predictions.
For the above Confusion matrix, Recall can be defined as:
Recall = XX / (XX + YX)
F-score
Evaluating different models is often a balancing act between improving precision or recall. For example, a model that blindly predicts churn 100% of the time will have a recall of 100% because it would’ve captured all the churners, but its precision would be much lower because of false positives.
As in data science, there is a tradeoff between improving recall and simultaneously improving precision. Improving Recall will increase Recall but will simultaneously decrease precision. A good implementation will try to reach an optimization point.
A measure that combines both values is the F1 score (which is a harmonic mean of precision and recall):
F-score = 2 * (precision * recall) / (precision + recall)
Now, let us apply these definitions to our use cases. PS:- We will not F-Score for our discussion.
Should we predict churn, or retention, or both? - why does it matter?
TL/DR—Churn Prediction and Retention Prediction are two different problems. Based on the desired objective, either one or both simultaneously could be chosen. A model focused solely on churn will be optimized to identify the factors contributing to churn but may overlook the factors that drive customers to stay or renew. Distinct models can better capture the nuances of each outcome.
In the normal mode of conversation, churn and retention are considered opposites.
Simplistically, after the end of a subscription period, if a customer stops using the product, it is considered to have churned; on the other hand, a customer who continues using the product (and has formally renewed) is considered retained. Various post-sales revenue leaders employ churn (or retention) Prediction to keep track of accounts that are likely to churn. Using this prediction model, they can employ proactive strategies to mitigate churn.
However, the factors and prediction design can differ depending on how the question is framed.
Let us understand with an example.
Churn/retention prediction problem.
Let us say we use a standard algorithm to predict churn. We will also use the same algorithm to predict retention (as the exact opposite of churn).
Proposition
For us to use the same algorithm to predict churn AND retention, this algorithm should perform similarly in both cases.
Let us see how the design and performance of the system change based on how the question is asked.
CASE A - Will this customer churn?
In this case, the question we are trying to answer while evaluating an account is, “Will this customer churn?”
Once the prediction system has reviewed all accounts in the corpus, we will see results like the following.
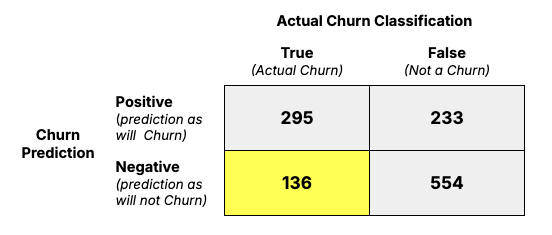
To explain this in simple terms, we have four cases.
True - Positive - Account was predicted as "will churn"; in reality, it churned - KNOWN REVENUE LOSS
False - Positive - Account was predicted as "will churn"; in reality, it did not churn - EXTRA WORK
True - Negative - Account was predicted as "will not churn", in reality It churned - UNKNOWN REVENUE LOSS
True - Positive - Account was predicted as "will not churn"; in reality it did not churn
From a business perspective, they would like to minimize #3 (True Negative), as the inability to predict Churn leads directly to revenue loss.
Now, let us revisit our performance indicators for this prediction system
Precision
Precision measures how many predictions are true. How many accounts were predicted to churn and actually churned?
True Positives /(True Positives + False Positives)
295 /(295 + 233) = 295 / 528 = 56%
This 56% is low and will result in many accounts being incorrectly predicted to have a risk of churn. This will result in extra work being put into accounts that did not need it in the first place.
Recall
Recall measures how many accounts that actually churned were identified by the prediction system.
True Positives /(True Positives + True Negatives)
295 /(295 + 131) = 295 / 431 = 68%
This Recall number of 68% is higher than Precision, which matters far more than precision. The higher the number, the greater the chance of identifying accounts at risk of Churn, which consequently affects the business's ability to reduce revenue losses.
F-score = 2 * (0.56 * 0.68) / (0.56 + 0.68) = 61%
TL/DR. The RECALL number matters more than the Precision number for a churn algorithm. Reducing True Negative is an important metric. However, both precision and recall cannot be increased simultaneously. Increasing Recall starts to reduce precision and vice versa. We have to settle instead on a different metric called F1 score, which is the harmonic mean of precision and recall. More discussion is available here.
CASE B - Will this customer retain?
Now, we will flip the question for the prediction system, “Will this customer retain?”
We will use the same numbers with the prediction system flipped so that we can compare them with CASE A.
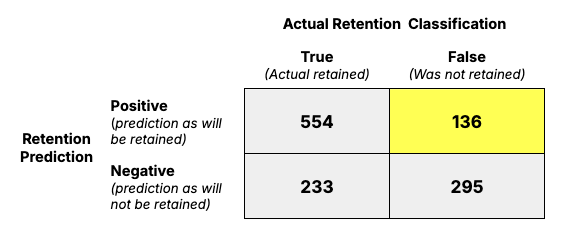
To explain this in simple terms, we have four cases.
True - Positive - Account was predicted as "will be retained"; in reality, it was retained - EXPECTED
False - Positive - Account was predicted as "will be retained", in reality, it was not retained - UNKNOWN REVENUE LOSS
True - Negative - Account was predicted as "will not be retained"; in reality, It was retained - EXTRA WORK
True - Positive - Account was predicted as "will not be retained"; in reality, it was not retained.- EXPECTED
From a business perspective, they would like to ensure that they minimize #2 (False Positive) as it is losing revenue by not working on accounts that the system predicted to be safe.
Now, let us revisit our performance indicators for this prediction system
Precision
Precision measures how many predictions are true. In this case, precision is the ratio of the number of accounts that were actually retained over the number of accounts that were predicted to be retained.
True Positives / (True Positives + False Positives)
554 / (136 + 554) = 554 / 690 = 80.28%
This 80.28% number is high for a retention prediction system and shows its efficacy.
Recall
Recall measures what proportions of retained accounts were successfully predicted by the system.
True Positives / (True Positives + True Negatives)
554 / (554 + 233) = 554 / 787 = 70.4%
This number is 70.4%, which means that the system only predicted 70% of the accounts that were actually retained.
While we still miss out in 30% of the cases, in practice, this only means that some customers (always going to renew) will get extra love.
What did we learn?
The algorithm above has a higher precision and recall score when it tries to answer “Will this customer retain?” than when it answers the question, “Will this customer churn?”
As a key takeaway,
It is essential to know the objective of the prediction system to determine which model to use.
Using both models simultaneously would be beneficial in the case of Churn and Retention, as it can give both the drivers of churn and retention. It is highly likely that at least some of the factors driving churn vs. retention are likely to be different.
Other considerations
Selecting data for an effective prediction system
Building a predictive system for churn and retention hinges on gathering the right data. Let's explore what data fuels such a system, considering how a B2B vendor interacts with its customers:
Data requirements:
Product usage: Track how customers utilize the product through the user interface, API, and integrations. This reveals feature adoption, frequency of use, and overall engagement.
Customer interactions: Capture interactions between customer users and your sales, customer success, and support teams. This encompasses messaging, meetings, emails, support tickets, and calls. These touchpoints offer insights into sentiment, pain points, and satisfaction levels.
External data: Gather data on the customer's company performance, such as financial reports, funding rounds, headcount changes, and industry news. This contextualizes their situation and helps predict potential churn triggers.
Understanding the customer journey:
Analyzing data from these touchpoints is crucial to gauge the customer's progress and value realization. For instance, successful onboarding involves more than just feature usage. It's about understanding adoption speed, sentiment expressed during onboarding interactions, and any support issues encountered.
In addition, a new customer and a customer in its second or third year of journey are not the same. A customer who is slow in adoption during their first month is not the same as someone who has not adopted despite spending more than six months in the system.
Building customer journeys captures these nuances and makes prediction systems far more effective.
Should you use time series data or point-in-time data to build prediction models?
Prediction models are only as good as the data they are built on. While point-in-time data provides useful snapshots, it’s limited because it only shows a static view of an account. Time series data, on the other hand, captures changes and trends over time, adding another dimension of information available to prediction models. Time series data provides important context, capturing:
Changes in product usage over time
Patterns of growth or decline
Recency and frequency of engagement
Let’s look at an example of product usage data from two accounts. Both have created 10 users and logged 100 product activities. With point-in-time data, that’s all you know.
But if I told you one account did this a year ago and hasn’t been active since, while the other has steadily added users and engaged with the product over the last 10 months, it would clearly show that one account is more actively engaged. This difference is important for accurately predicting churn or retention.
User vs account prediction - How do we reconcile?
While both focus on predicting customer behavior, user-level churn and retention predictions analyze individual user interactions within a product. In contrast, account-level predictions consider the activity of the entire organization.
Though often connected, these two perspectives can sometimes diverge. For example, a single user might churn, but if others within the same account remain active, the account itself could still be retained.
Account-level activity is often more critical, especially in products where usage is driven by automated systems rather than direct user interaction. For instance, in a firewall product, network firewall events would constitute product usage at the account level, even with minimal individual user engagement.
Conversely, an account can churn even if all users are actively engaged due to factors like leadership changes, budget cuts, or switching to a competitor. However, if key users disengage, the likelihood of account churn increases.
In seat-based pricing models, accounts predicted to renew but with a high likelihood of users getting churned deserve attention, as this could indicate potential license reductions upon renewal.
More sophisticated models generally combine user and account-level predictions.