Ops & Leadership Intelligence
Turn Executive BI Requests into Autonomous Agents.
Stop battling the reporting backlog. Empower your Ops and BI teams to vibe-code AI Agents that deliver governance, executive dashboards, and autonomous intelligence at scale—reducing days of manual work to minutes.
 RECOGNIZED BY GARTNER
 #1 — WINNING BY DESIGN 2025
 ZERO AI PoCs LOST IN 2025

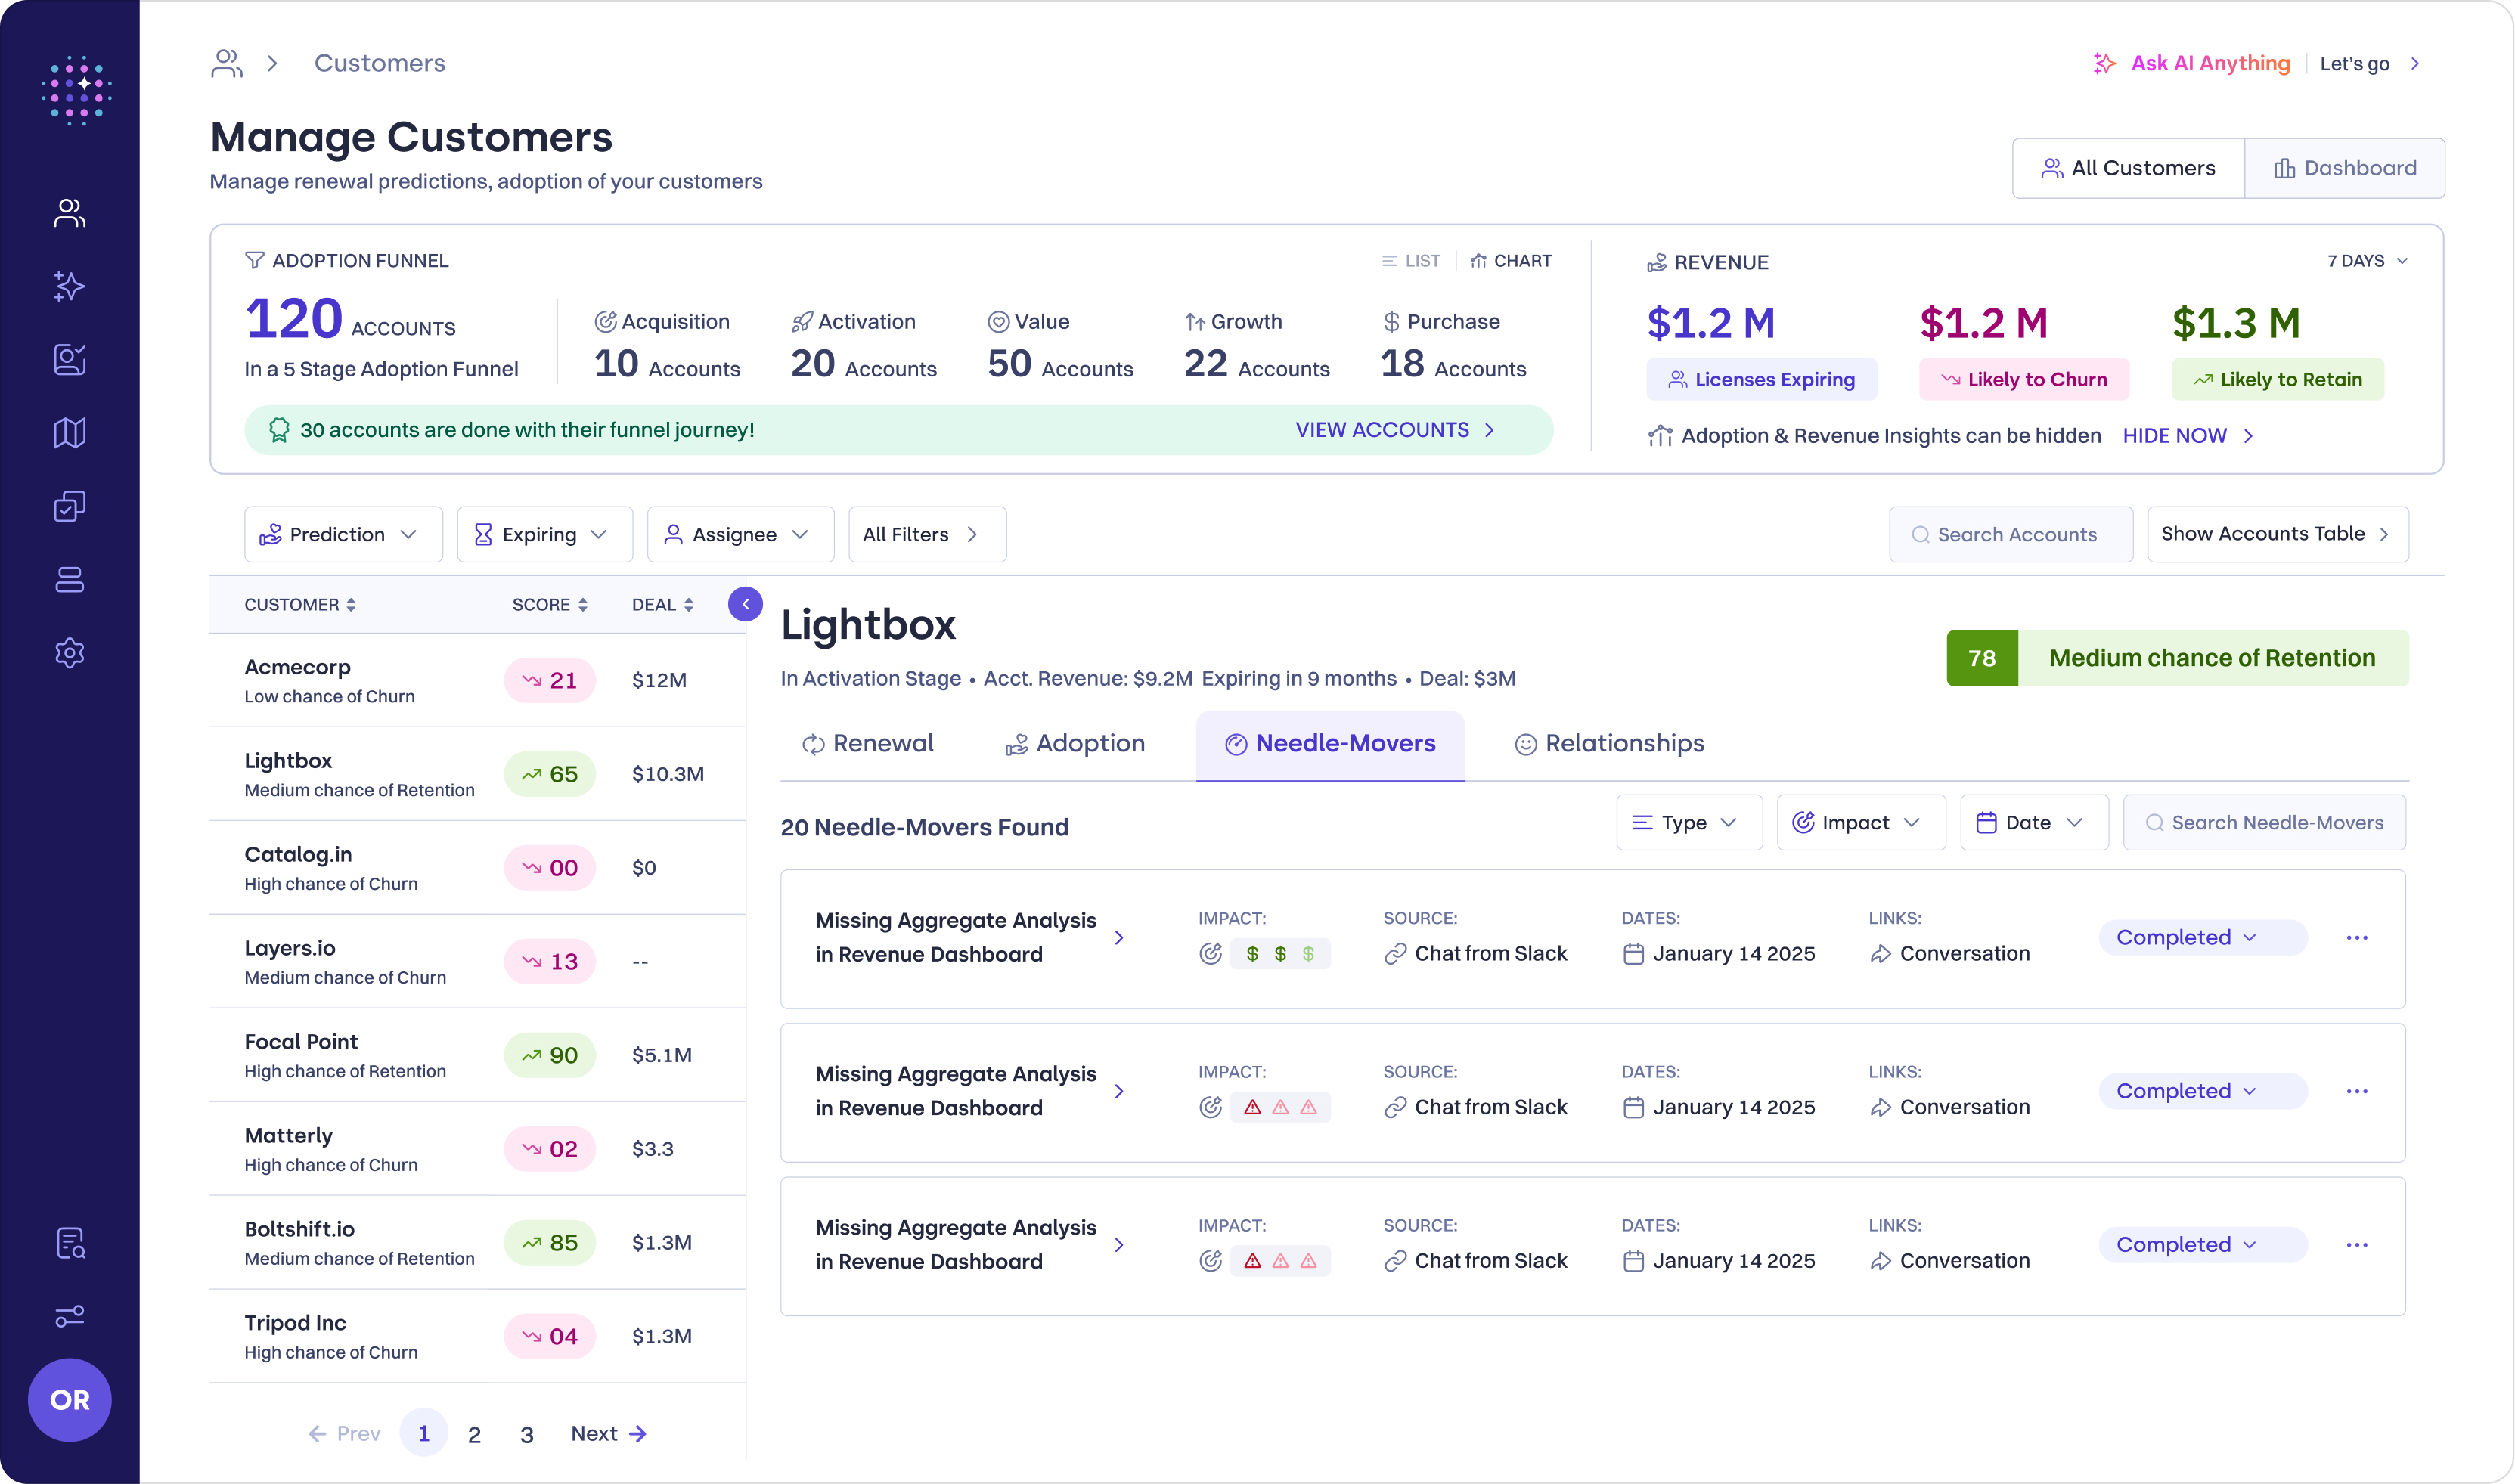
“FunnelStory helps me understand our customer journey across both sales and post-sales. I now rely on it daily to track feature adoption and flag at-risk accounts.“

Gilad Shriki
Co-Founder, Descope
Why FunnelStory is the solution
Deliver Intelligence at the Speed of Leadership
Transform how your organization consumes data. Move from reactive, manual reporting to proactive, autonomous governance.
The Reality
The Reality: Slow & Unscalable
The manual approach to generating executive intelligence is slow, repetitive, and impossible to scale. Internal BI and Ops teams are constantly bogged down by one-off leadership requests, spending hours slicing data instead of driving strategy.
- Days spent compiling weekly risk roll-ups.
- Data is stale by the time it reaches the board.
The Fix
Vibe-Code to Scale
With FunnelStory, Ops and BI leaders can create powerful AI Agents just by describing what they need in plain English. Turn complex business intelligence requests into autonomous workflows that deliver mathematically validated insights instantly.
- Agents run 24/7 on the Customer Intelligence Graph.
- Zero developer bandwidth required.
80–90%
Effort Reduction
Automate the heavy lifting of data compilation and formatting.
10 Mins
From 2 Days of Work
Instant turnaround for complex, multi-source reporting.
Infinite
Scale Without Headcount
Show leadership unmatched speed without adding to your BI team.
Autonomous agents
An Autonomous Agent for Every Executive Question
Deploy a fleet of specialized AI Agents to monitor, forecast, and report on your most critical business metrics 24/7.
Revenue & Growth
Track ARR waterfall and revenue health, renewal forecasts and modeling, customer LTV, and product bundling opportunities in one place.
Risk & Governance
Surface portfolio and downstream risk, cohort retention, logo retention modeling, and automated anomaly alerts before they escalate.
Operations & Performance
Monitor CSM performance and capacity, value drivers, forecast analysis, and QBR generation automation without manual roll-ups.
See your graph
Know what your agents know.
An agent is only as good as the context behind it. Ops sees exactly what the graph holds, and where it needs more, before leadership relies on the answer.
Coverage across your book
See everything FunnelStory has computed about your customers, and how fresh each part is.
Where the graph is thin
Spot high-ACV accounts with no recent conversation, before an agent has to reason without context.
One account, end to end
Explore an account as a live map of people, conversations, needle movers and actions, replay how it grew week by week, and trace one conversation through to the actions it produced.
Customer Intelligence Graph
Example workspace412 / 450
Accounts with recent activity
6,820
Conversations in the last 30 days
138
Open needle movers
Thin graph · high ACV, no recent conversation
Make it yours
Your data, your scores, your systems.
FunnelStory doesn't make you adopt someone else's model of the business. Build the data you need on top of the graph, and send the results back where your teams already work.
Data Apps
Build your own data
Define scorecards, success plans and review worksheets once, and fill them in for every account. Values come from your datasets, queries, your team, or calculations over all three.
Your own health scores
Score accounts your way
Calculate the health score your business actually runs on, publish an official version each period, and keep a full history of who changed what.
Write-back
Results land in your systems
Agents update Salesforce and HubSpot records and write results back to BigQuery. Data Apps show inside HubSpot records, or share by link and embed.
Intelligence where you work
Delivered Exactly Where Leadership Lives
No new portals to log into. FunnelStory pushes executive intelligence directly into the tools your leadership team already uses to make decisions.
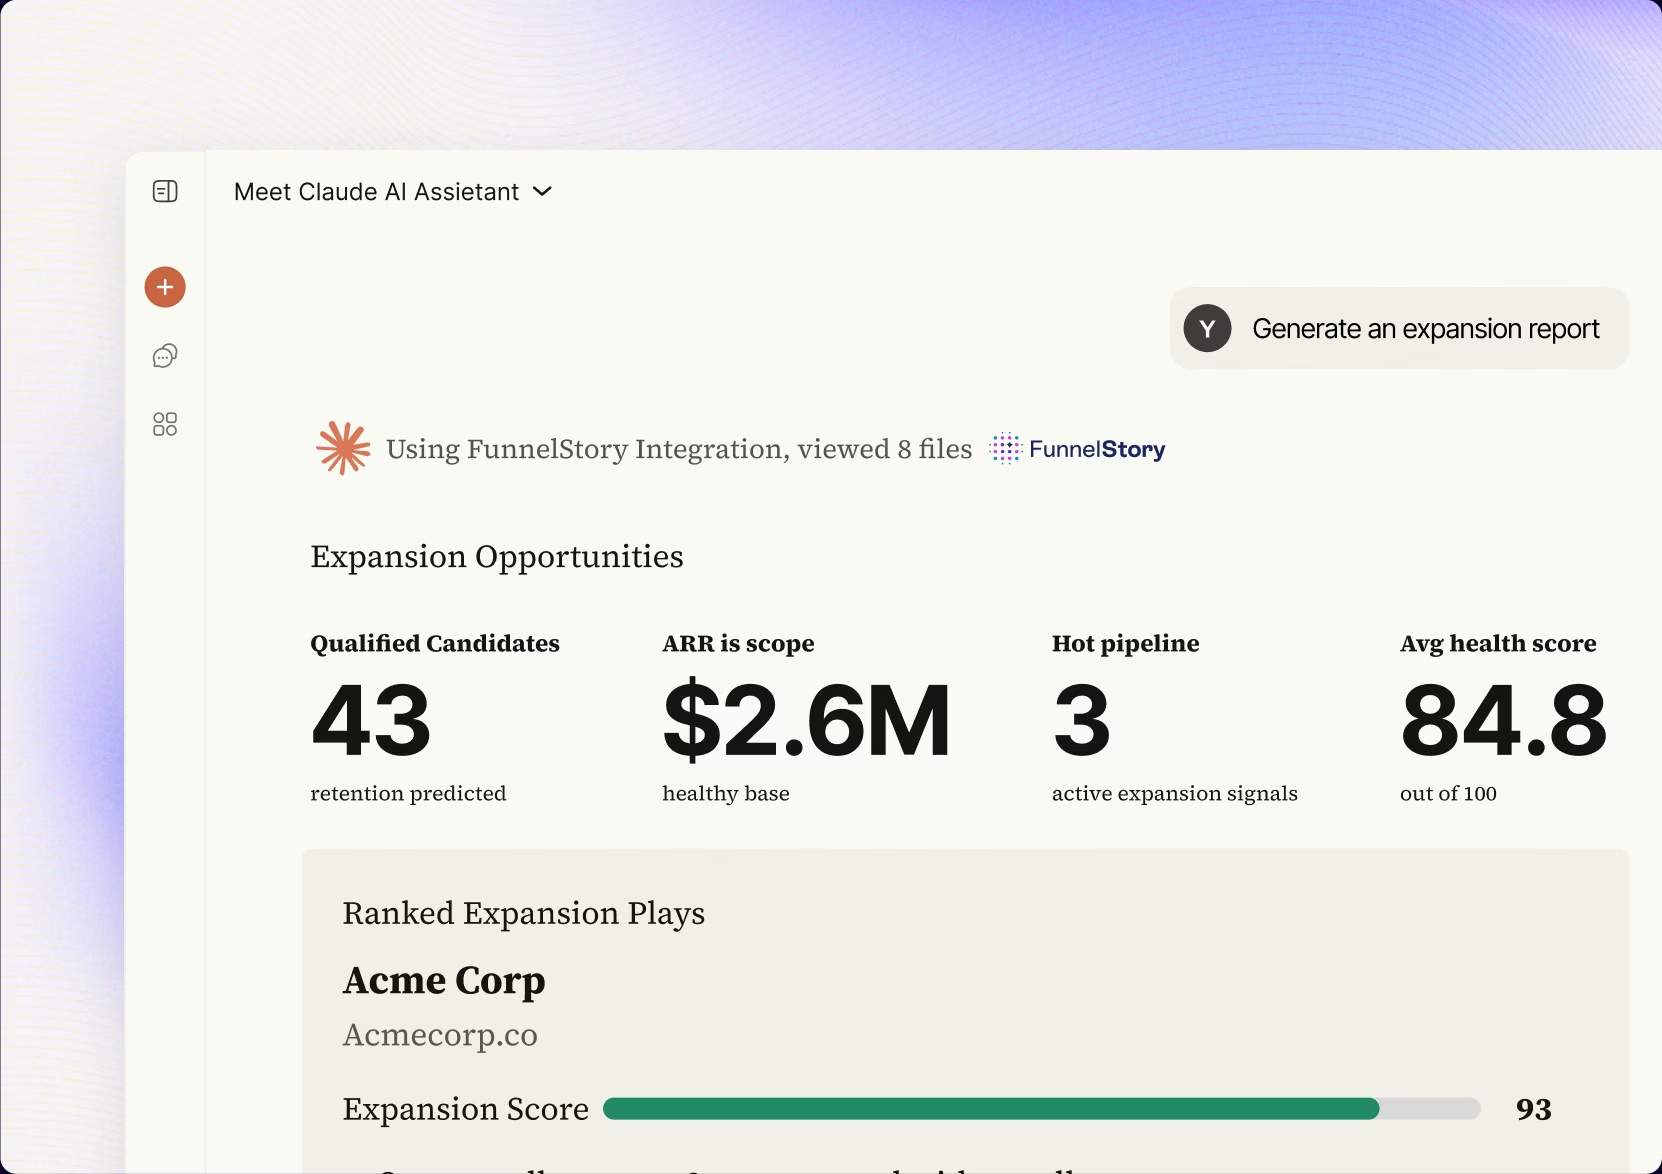
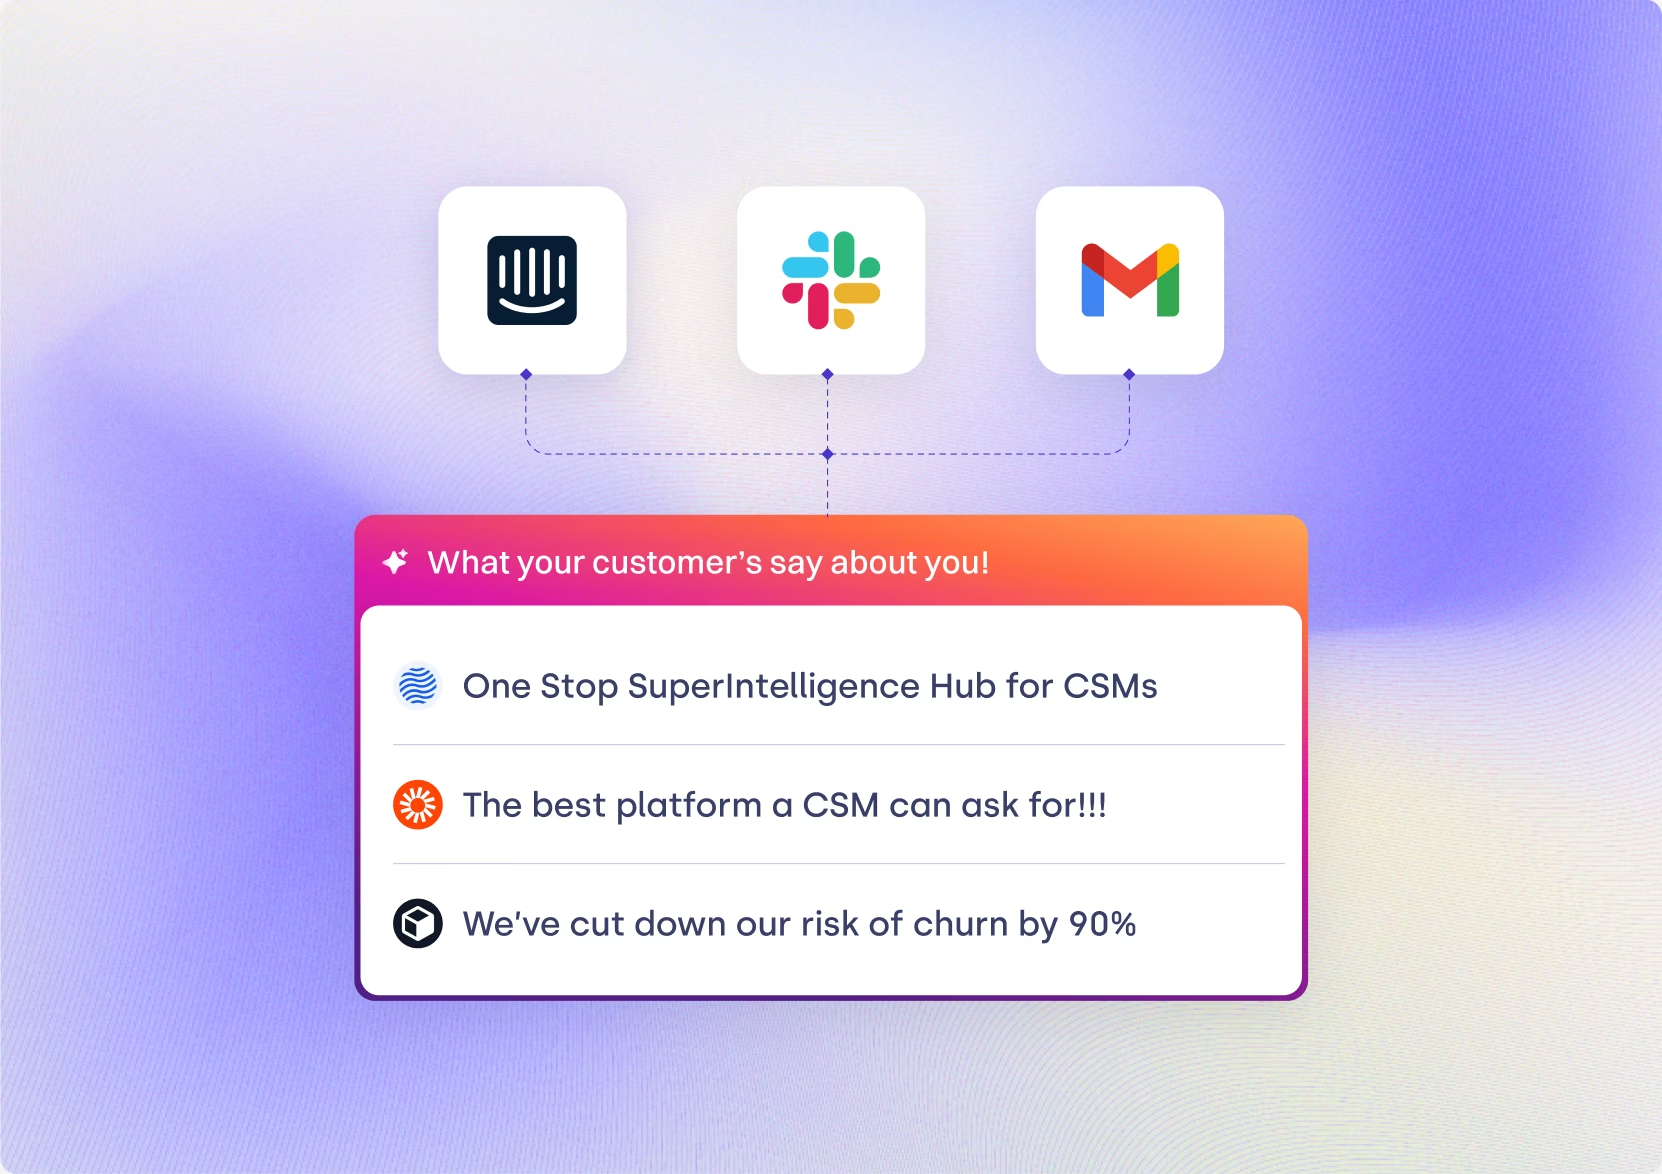
Push your autonomous BI directly into Claude, ChatGPT, Gemini, or any MCP client. Chat with your data natively.
Why teams trust FunnelStory
Recognized, proven, and built for the enterprise.
Recognized by Gartner
Enterprise-grade compliance
#1 — Winning by Design
Top AI solution for Customer Success, Expansion & Renewals, 2025.
Zero AI PoCs lost in 2025
Every proof-of-concept we ran converted. The foundation shows up in the pilot.

Unified Journey — patent-pending
Our Unified Journey and needle-mover methods are patent-pending technology.

Enterprise security in our DNA
Built by founders with deep enterprise-security backgrounds.

Governed & auditable
Role-based, permissioned access to every part of the context graph.